Analytics and Automation·Besiders, since 2002
Marketing Dashboards in Power BI and Looker Studio
We build marketing dashboards for owners and marketing managers who are tired of piecing together screenshots from five platforms. One view, built in Power BI or Looker Studio, shows where enquiries and revenue come from and what each channel costs.
What our marketing dashboards include
Question-led design
We start from the decisions you make each month and design pages to answer them, not to display every available metric.
Connected data sources
Google Ads, Meta, GA4, Google Search Console and your CRM or sales data brought together in one report.
Consistent definitions
Leads, conversions and costs calculated the same way across channels, so comparisons are fair.
Views for each audience
A short summary for owners and a detailed view for the marketing team, from the same underlying data.
Automatic refresh
Data updates on a schedule, so nobody has to export spreadsheets before a meeting.
Handover and training
We walk your team through the dashboard and document how each figure is calculated.
A dashboard is only as useful as the questions behind it
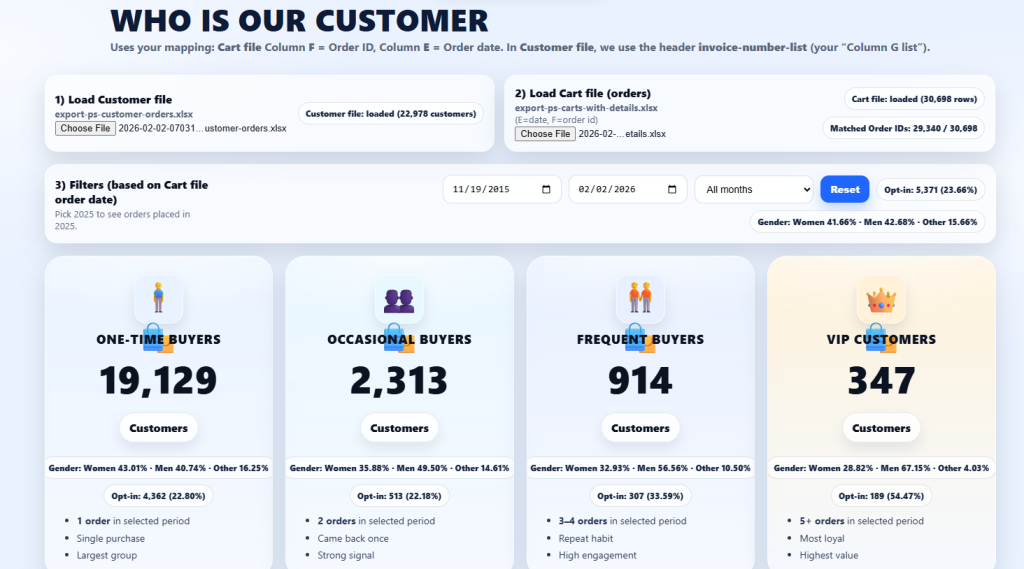
Most marketing dashboards fail quietly. They are built once, packed with charts, admired in the first meeting and then ignored. The reason is usually that they show what the platforms report rather than what the business needs to decide. Impressions, clicks and reach are easy to pull in, so they fill the screen, while cost per qualified enquiry or revenue by channel is missing because it needs CRM or sales data.
Choosing between Power BI and Looker Studio matters less than people think. Looker Studio connects easily to Google products and suits teams that live in Google Ads and GA4. Power BI handles larger data models, more complex calculations and companies already using Microsoft tools. We recommend based on your data sources, who will use the report and who will maintain it, not on preference.
A good dashboard also has to be honest about its limits. Attribution is never perfect, and platform data is sometimes delayed or revised. We label where numbers come from and how they are calculated, and we flag where tracking is incomplete rather than hiding it. That transparency is what makes people keep opening the report each month, trust what it says and act on it.
How we build marketing dashboards
Questions
We interview the people who will use the dashboard and list the decisions it must support.
Data
We check each data source for accuracy and fix tracking gaps before connecting it.
Build
We design and build the dashboard in Power BI or Looker Studio, then review it with you on real data.
Refine
We adjust after it has been used in practice and keep it working as platforms and campaigns change.
Why Besiders for marketing dashboards
We understand the data
We run campaigns and SEO ourselves, so we know what each platform's numbers mean and where they mislead.
Tracking first
We fix the tracking underneath before building charts, so the dashboard reflects reality.
Built for your team
Reports are designed for the people who use them, in English, Arabic or French where needed.
Frequently asked questions
Should we use Power BI or Looker Studio for marketing dashboards?
Looker Studio is usually simpler for teams working mainly with Google Ads, GA4 and Search Console. Power BI suits more complex data, larger datasets and organisations already using Microsoft tools. We recommend one after reviewing your sources and users.
Can the dashboard include CRM and sales data?
Yes, and we recommend it. Linking marketing data to CRM or sales records is what turns a traffic report into a view of cost per enquiry and revenue by channel.
How often does the dashboard update?
Dashboards refresh automatically on a schedule that depends on the data sources and tool you choose. Some platforms also revise recent data, which we explain in the report.
Who owns the dashboard?
You do. We build it in your own accounts where possible and hand over documentation, so you are not tied to us to keep using it.
What if our tracking is not accurate yet?
Then we fix that first. A dashboard built on broken tracking simply presents wrong numbers more attractively, so we review GA4 and conversion tracking as part of the project.